
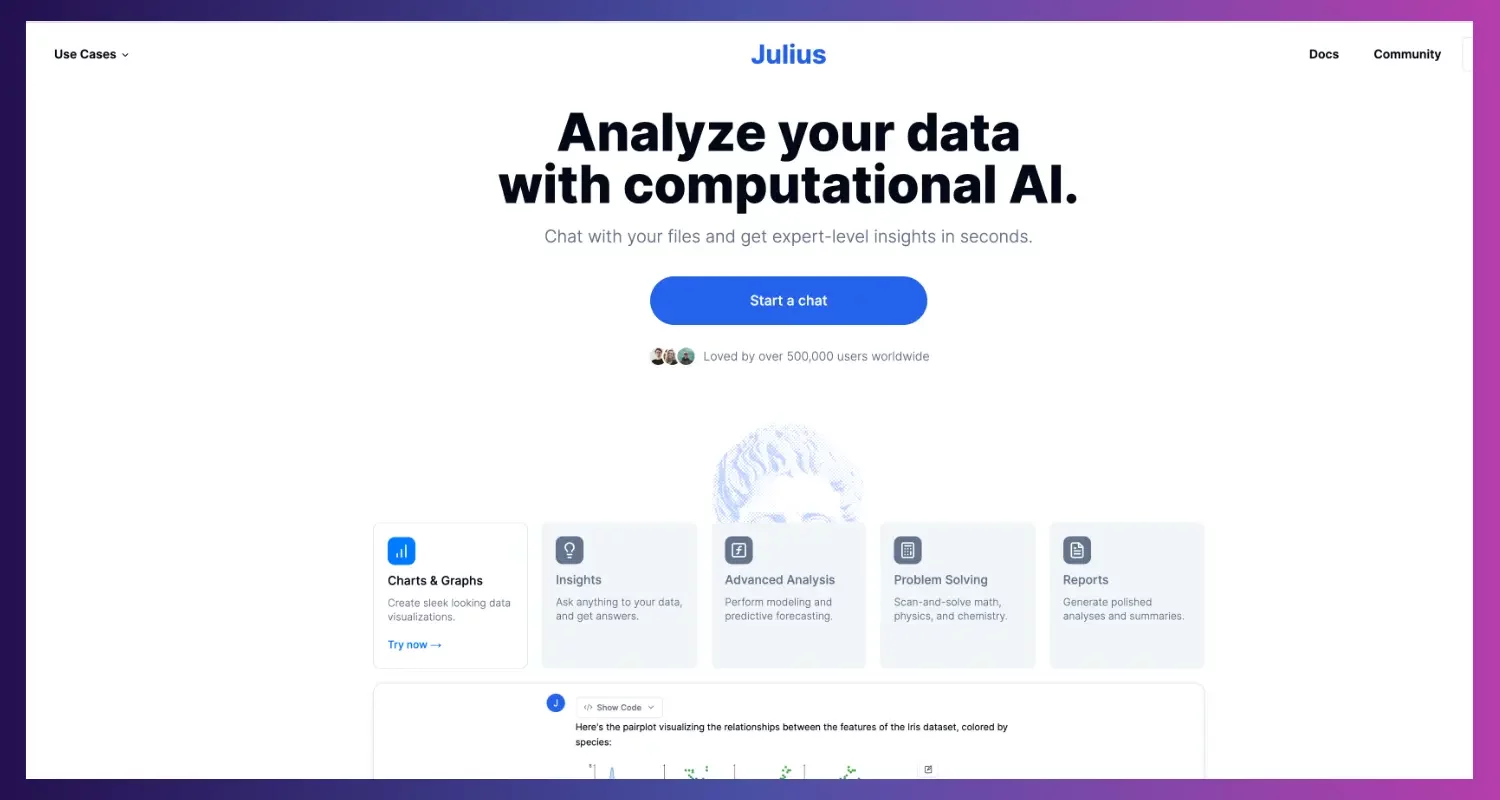
Julius AI is an AI-powered data analysis tool designed to make complex data analysis and visualization accessible to everyone, regardless of their technical or coding expertise. It functions as a conversational assistant, allowing users to interact with their data using natural language prompts (plain English) rather than code. You can upload various file types, such as Excel, CSV, Google Sheets, and PDFs, and then ask Julius to perform tasks like data cleaning, statistical analysis, and generating visualizations.
How it is Unique from Other Tools (What’s New)
Julius AI is like having an in-house data scientist. Unlike general-purpose chatbots, it can use powerful Python and R queries to mine valuable data spread across multiple sources, giving you deeper insights.
- Dedicated Data Agent vs. General AI: Unlike a broad tool like ChatGPT, which is a conversational AI for a variety of tasks, Julius AI is a specialized “agent” built specifically for data analysis. It’s designed to solve problems in a multi-step, focused way, making it more accurate and reliable for statistical and data-driven tasks.
- No-Code Automation: It automates the entire data analysis process, from data cleaning and preparation to advanced statistical modeling, all without the user having to write a single line of code. This is a significant departure from traditional tools like Python or R, which require extensive coding knowledge.
- “Show Code” Transparency: For users who are interested in the technical details, Julius AI offers a “show code” feature. It reveals the underlying Python or R code it used to generate the analysis. This is a unique learning tool that helps users understand how the analysis was performed and can be a valuable resource for students and aspiring data scientists.
- Enhanced Visualization: It can automatically create a wide range of polished visualizations, including charts, graphs, and even animated GIFs, based on your prompts. This goes beyond the basic charting capabilities of spreadsheets and automates the process of selecting the most appropriate visualization for the data.
Features
1. Personalized Onboarding
- Julius customizes your experience based on your goals:
- For work, personal use, or education.
- Further tailored by your role (Engineering, Leadership, Data Science, Product, etc.) and intentions (visualizations, insights, reports, etc.).
2. Data Upload & Integration
- Julius supports seamless data intake through multiple options:
- Upload files directly.
- Connect to cloud or database sources like:
- Google Drive, Microsoft OneDrive / OneDrive for Business, Notion, GitHub and many more.
- PostgreSQL, BigQuery, SupaBase, Snowflake for direct database connectivity.
MCP (Model-Connected Plugin) connectors allow Julius to run AI-powered tasks like summarizing GitHub issues, analyzing Intercom feedback, and more.
3. Julius Prompting & Auto-Coding
- Ask questions in plain English (e.g., “Calculate the total amount”).
- Julius translates your query into Python code behind the scenes using built-in LLMs.
4. Interactive Chart Building
- Julius assists in creating charts from your uploaded or connected datasets.
- You can select from multiple chart styles or build from scratch.
- Themes available for visuals:
- Julius
- Scientific
- Business
- Interactive (Beta)
- Dark mode
5. Calibrate Your Analysis
- Users can fine-tune Julius to:
- Get data insights, perform statistical analysis, predict outcomes (modeling), visualize data, merge or validate spreadsheets, generate reports automatically, get programming help
- Supports both guided workflows and open-ended analysis.
6. Model & Tool Selection
- Julius supports multiple powerful models:
- J: Default
- GPT 4.1
- Claude 4 (Sonnet & Opus)
- o3
- o4-mini
- Also lets you toggle between advanced tools like:
- Advanced Reasoning: Turns on a more deliberate thinking mode. The model takes extra passes to plan, check assumptions, and chain multi-step logic.
When it helps:
- Messy or ambiguous requests that need step-by-step deduction
- Causal questions like “what likely drove this spike” vs simple “what changed”
- Multi-table joins or nested filters where order and edge cases matter
- Choosing the right statistical test or forecasting setup from several options
What you get: Higher accuracy on hard problems, better sanity checks, clearer explanations.
Trade-off: A little slower and may use more compute.
- Extended Memory (for long analysis sessions):
What it is: Keeps conversation state and results handy so you can build on earlier steps without re-explaining everything.
When it helps:
- Long, exploratory sessions that evolve from cleaning data to modeling to reporting
- Workflows where the next question depends on the previous output
- “Pick up where we left off” scenarios across a day or meeting
7. Notebook & Prompt Saving
- Save your favorite prompts or workflows for reuse:
- Save prompts/workflows once and rerun with new data → no need to rebuild each time.
- Great for recurring tasks (monthly CRM, weekly revenue forecast, campaign reports).
- Benefits: consistent metrics, faster turnarounds, fewer errors.
- Build entire notebooks for specific use cases such as:
- CRM analysis
- Marketing summaries
- Revenue prediction
- Scientific workflows
8. Use Case Templates
- Predefined templates by domain:
- Finance: Forecast trends
- Marketing: Summarize messy data
- Data Science: Automate complex analysis
- Scientific Research: Visualize and extract
- Education: Share workflows and teach AI-based analysis
Advantages
- Democratizes Data Analysis: Makes data analysis accessible to non-technical users, business professionals, and marketers.
- Speed and Efficiency: Significantly reduces the time spent on data preparation and analysis, turning hours of manual work into minutes.
- User-Friendly Interface: The conversational chat interface is intuitive and requires minimal learning curve.
- Robust Data Handling: Can handle a variety of large datasets, with paid plans supporting files up to 32 GB.
- Advanced Features Made Simple: Simplifies complex tasks like predictive forecasting, regression analysis, and data modeling.
Disadvantages
- Dependent on Data Quality: Effectiveness can be limited by messy or poorly formatted data, which may require manual cleaning before accurate insights.
- Potential for Misinterpretation: If a user asks an ambiguous or poorly-phrased question, the results may be misleading.
- Struggles with Lengthy PDFs and Reports: A limitation is its struggle with long documents like extensive PDFs or reports. Specialized tools leveraging Retrieval-Augmented Generation (RAG) are often more effective here.
- Cost for Advanced Use: The free tier is quite limited; serious, continuous use requires a paid subscription.
Pricing
Julius provides flexible plans tailored to different levels of usage, from casual users to enterprise teams.
To know more, visit: https://julius.ai/pricing